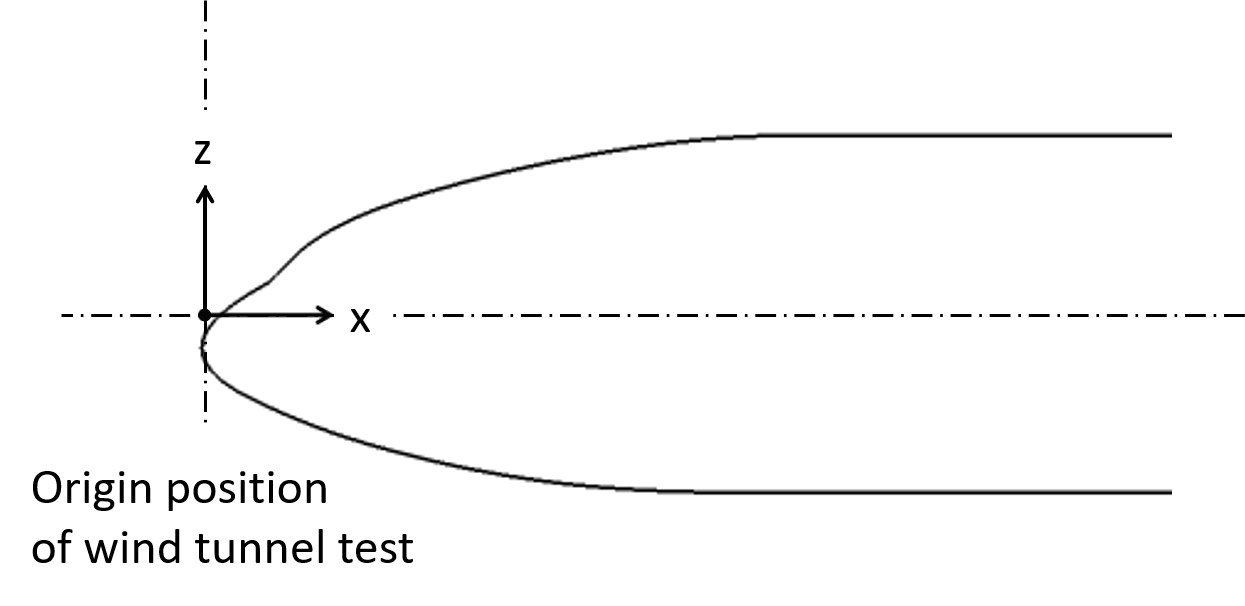
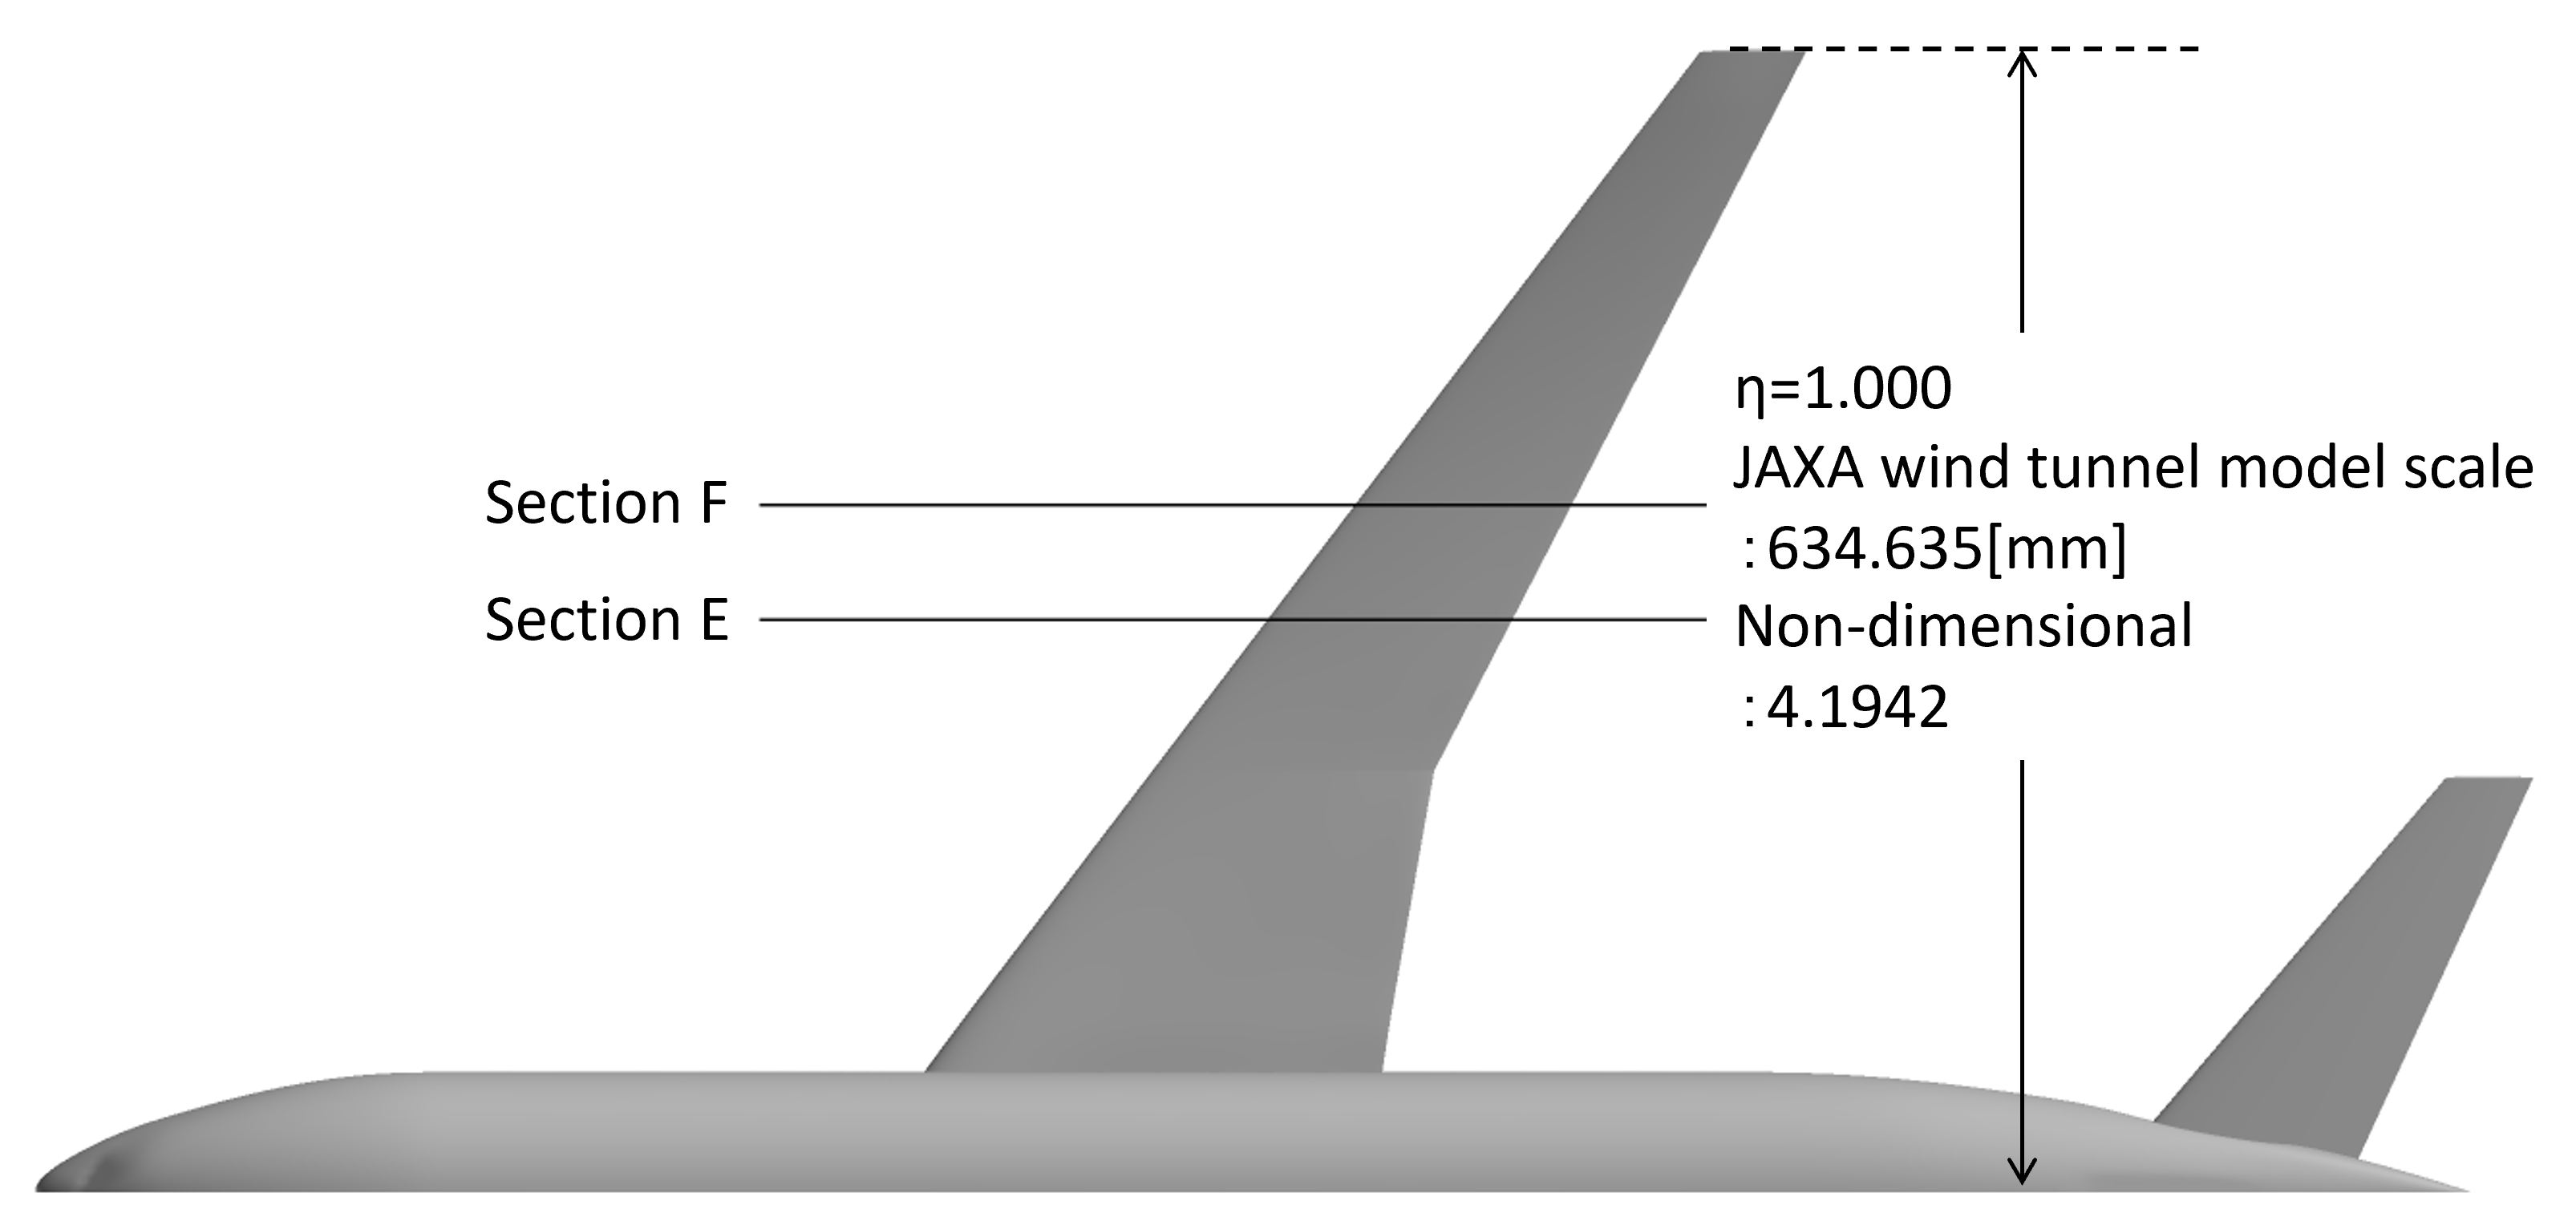
Inner wing: wing-body junction to Yehudi break (trailing-edge discontinuous bend); Mid/Outer wing: equally divided from Yehudi break to wing-tip.
Aerodynamic coefficients
The values are corrected for JAXA wind tunnel test.
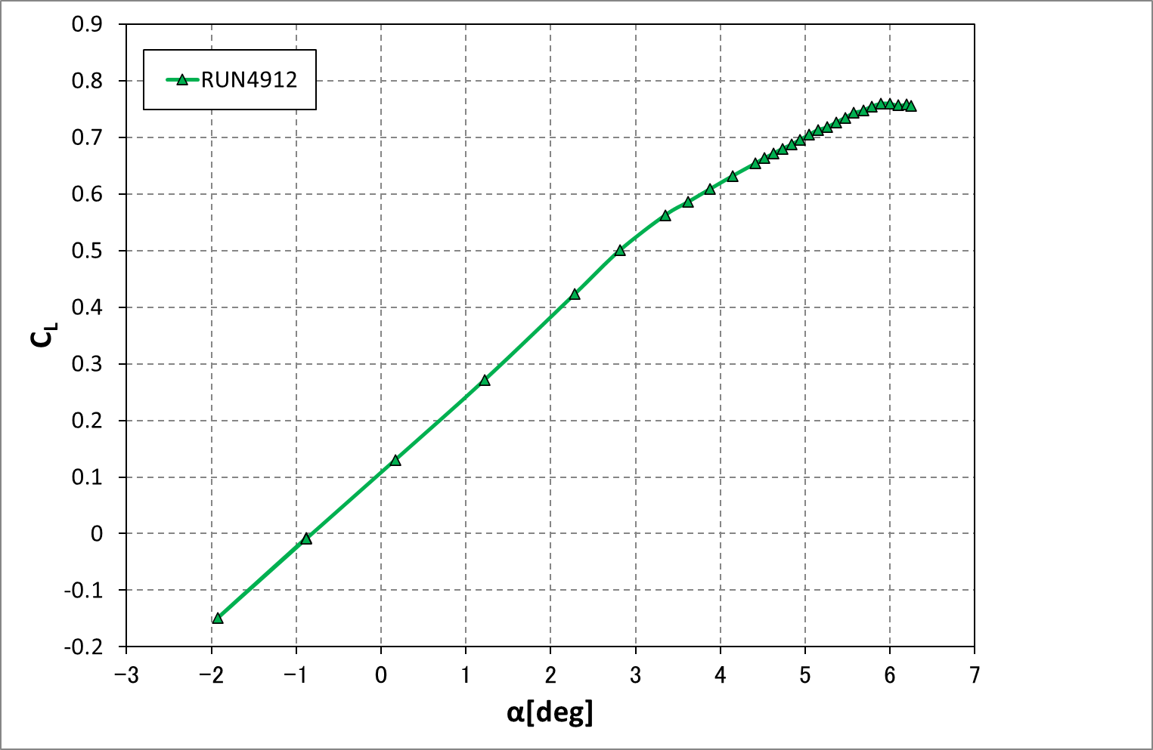
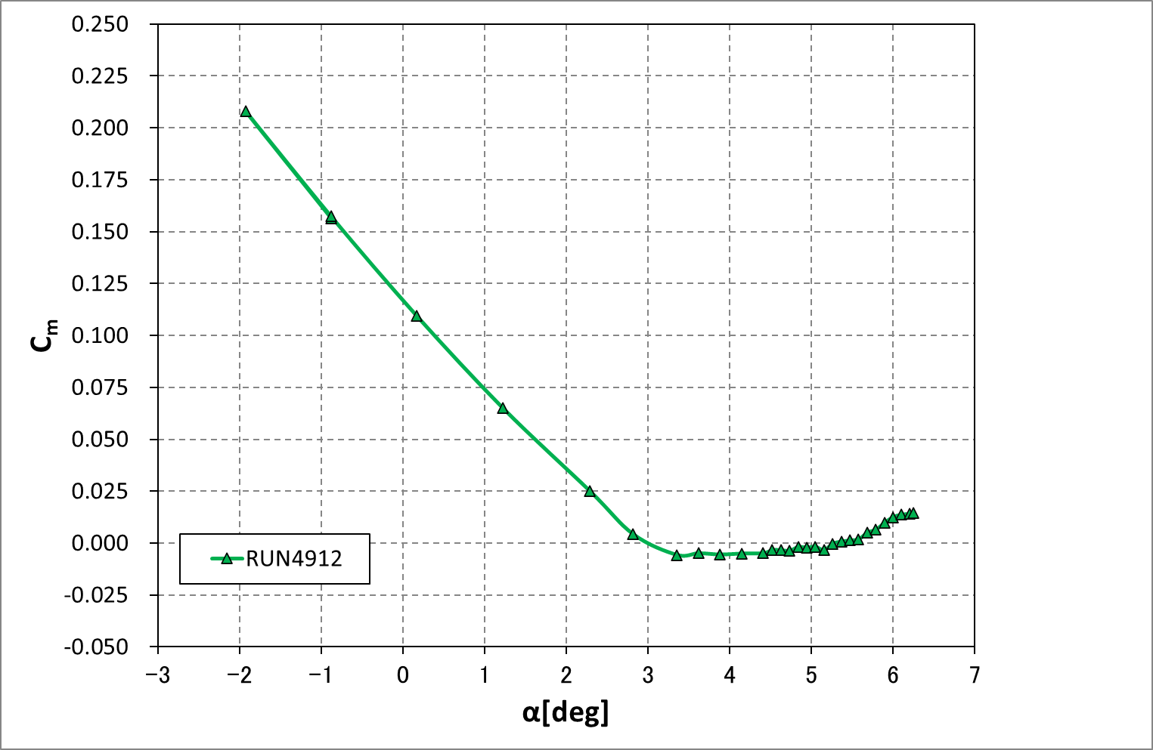
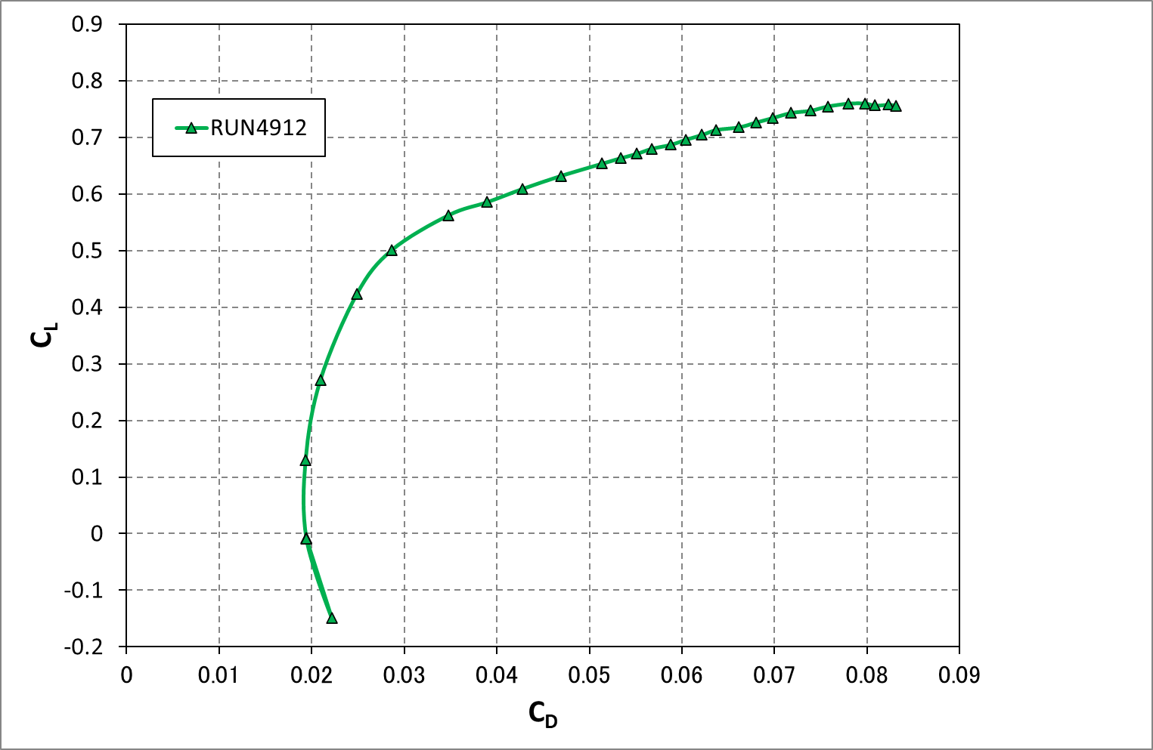
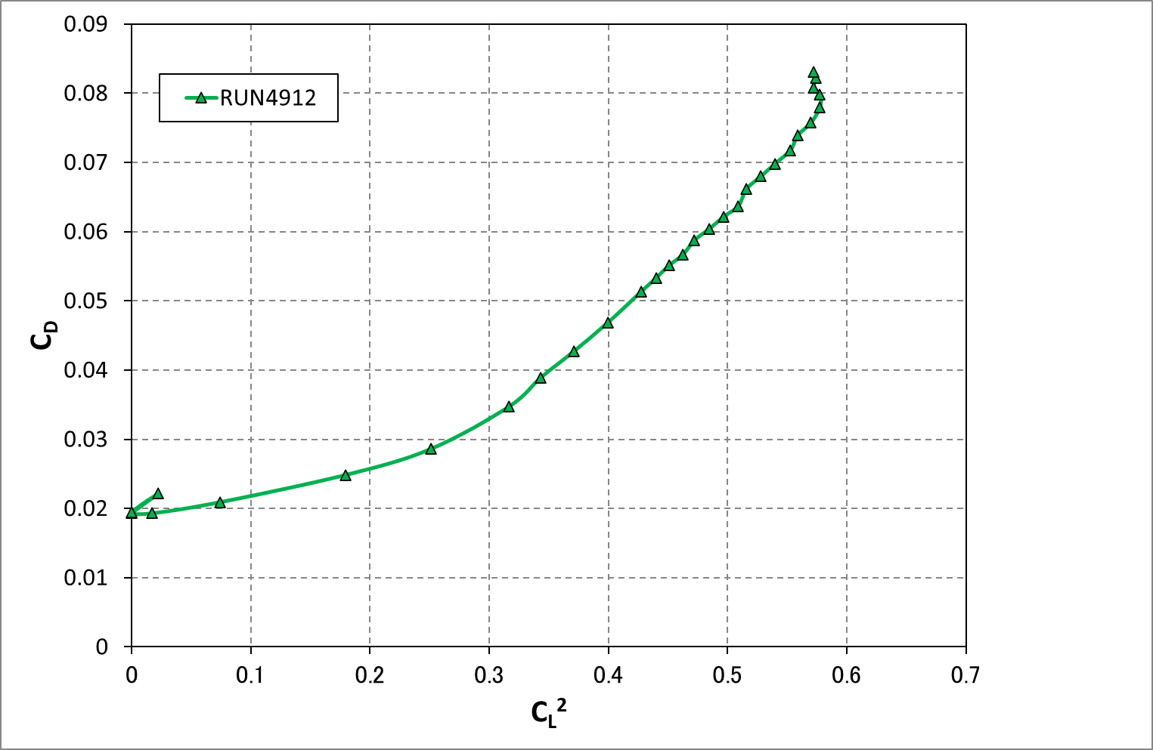
| RunNo. | CaseNo. | Re | P0 | T0 | M | α | CD | CL | CmS | CSV file |
| 4912 | 20 | 1.52 | 80.0 | 323 | 0.849 | 1.22 | 0.0209 | 0.2718 | 6.503e-2 |
buffet-TC2_cdclcm_dpw8.csv
(Data from CaseNo.16 to 45) |
| 4912 | 21 | 1.52 | 80.0 | 323 | 0.849 | 2.29 | 0.0249 | 0.4237 | 2.508e-2 | |
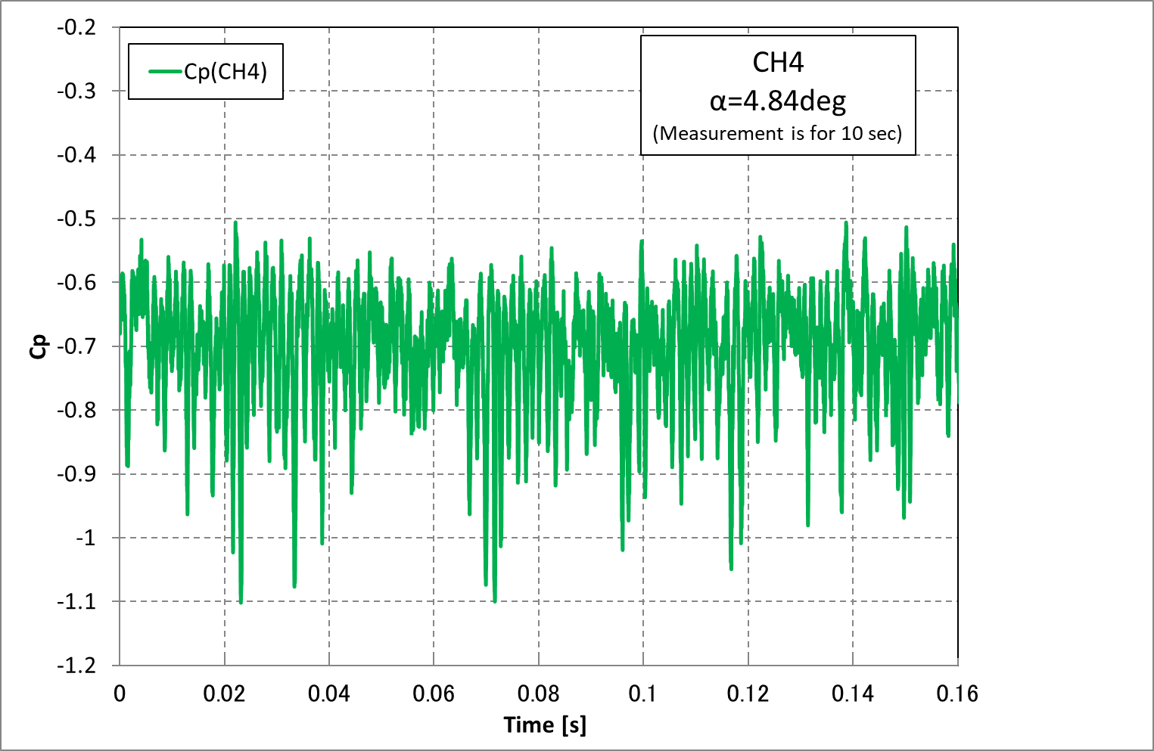
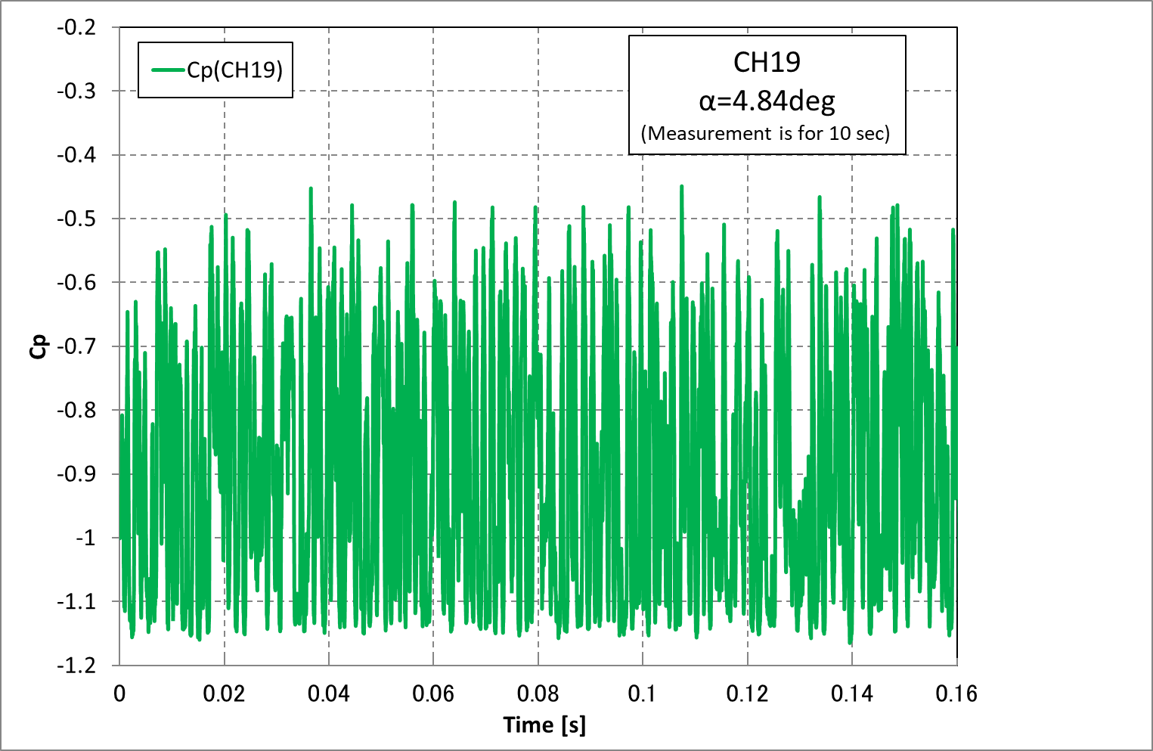
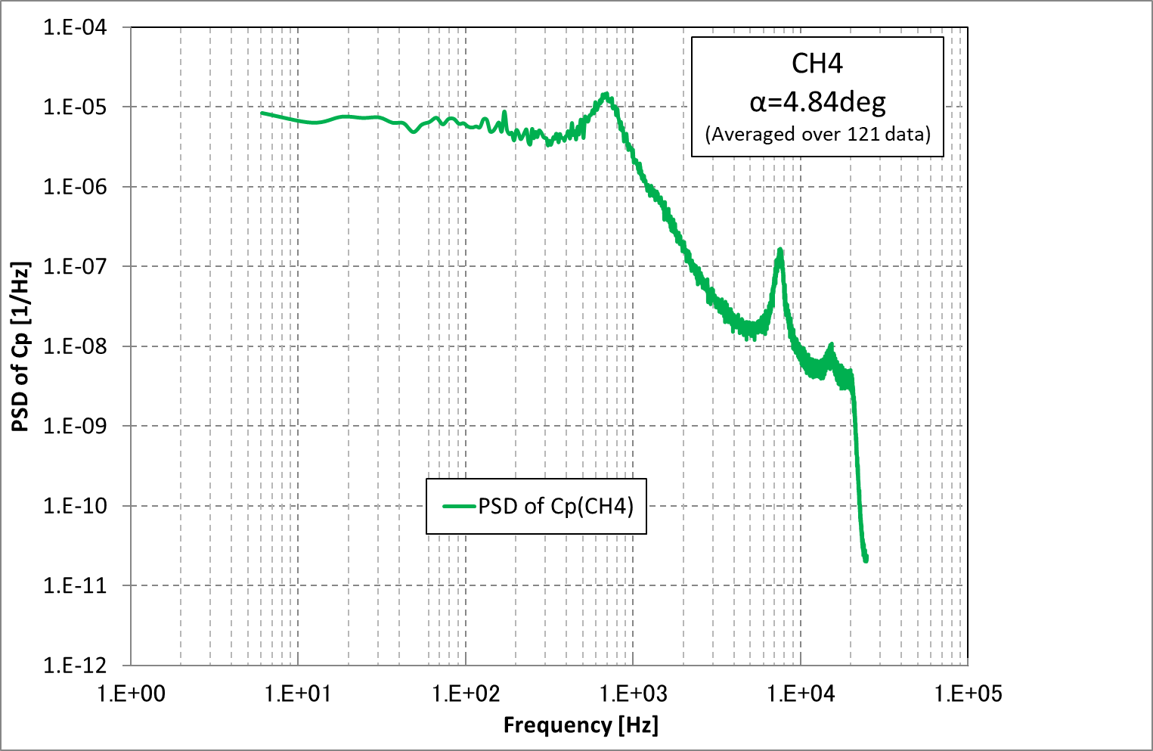
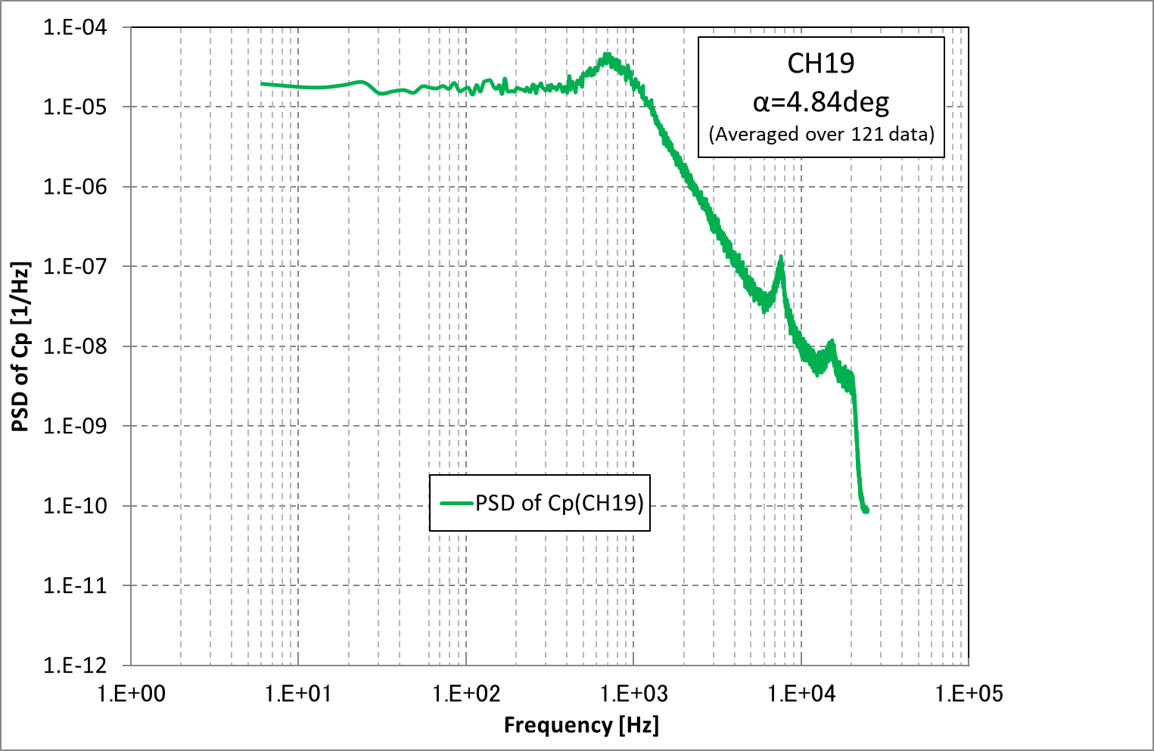
| 4912 | 31 | 1.52 | 80.0 | 323 | 0.849 | 4.84 | 0.0588 | 0.6872 | -0.193e-2 | |
| 4912 | 41 | 1.52 | 80.0 | 323 | 0.848 | 5.89 | 0.0780 | 0.7598 | 0.984e-2 |
| Re | : Reynolds number [million] based on MAC |
| P0 | : Total pressure [kPa] |
| T0 | : Total temperature [K] |
| M | : Corrected Mach number [-] |
| α | : Corrected angle of attack [deg] |
| CD | : Corrected drag coefficient [-] |
| CL | : Corrected lift coefficient [-] |
| CmS | : Corrected pitching moment coefficient [-] |
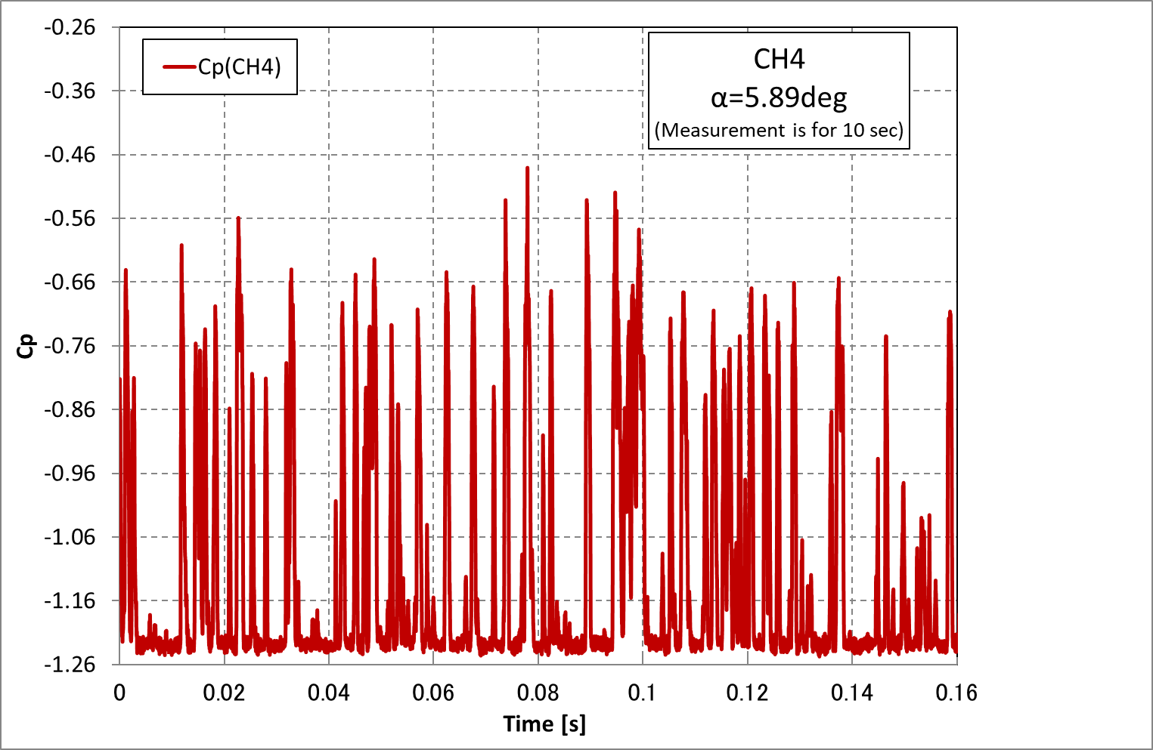
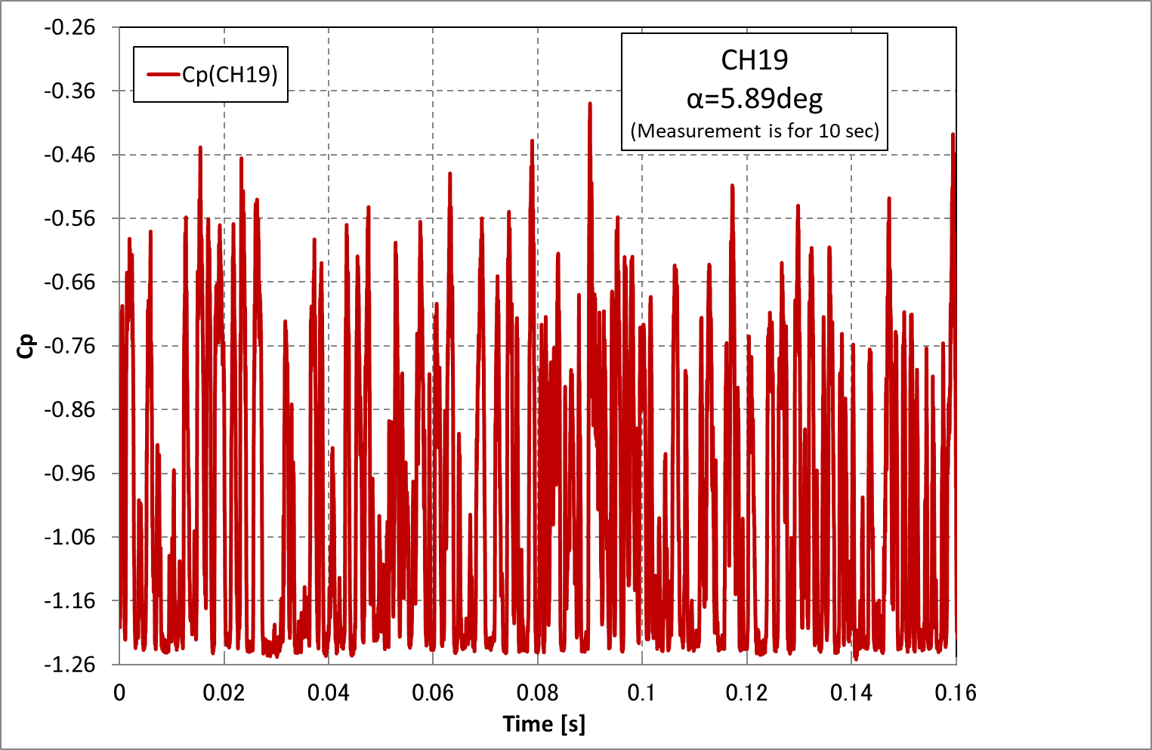
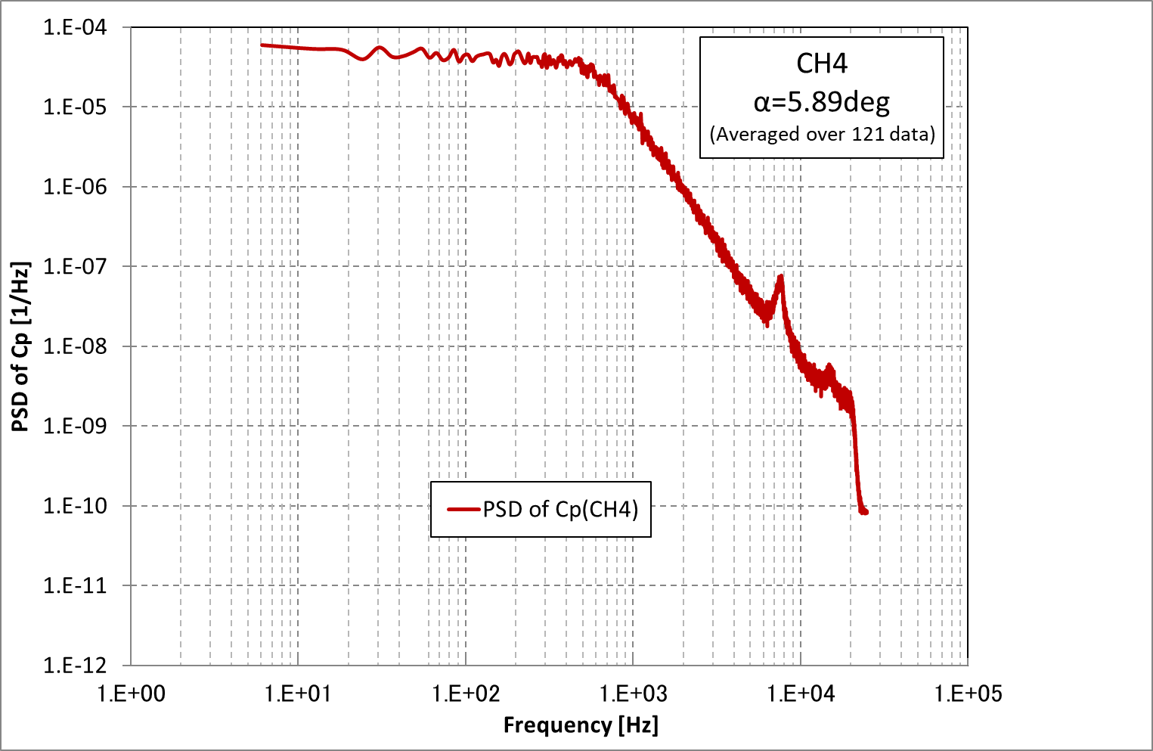
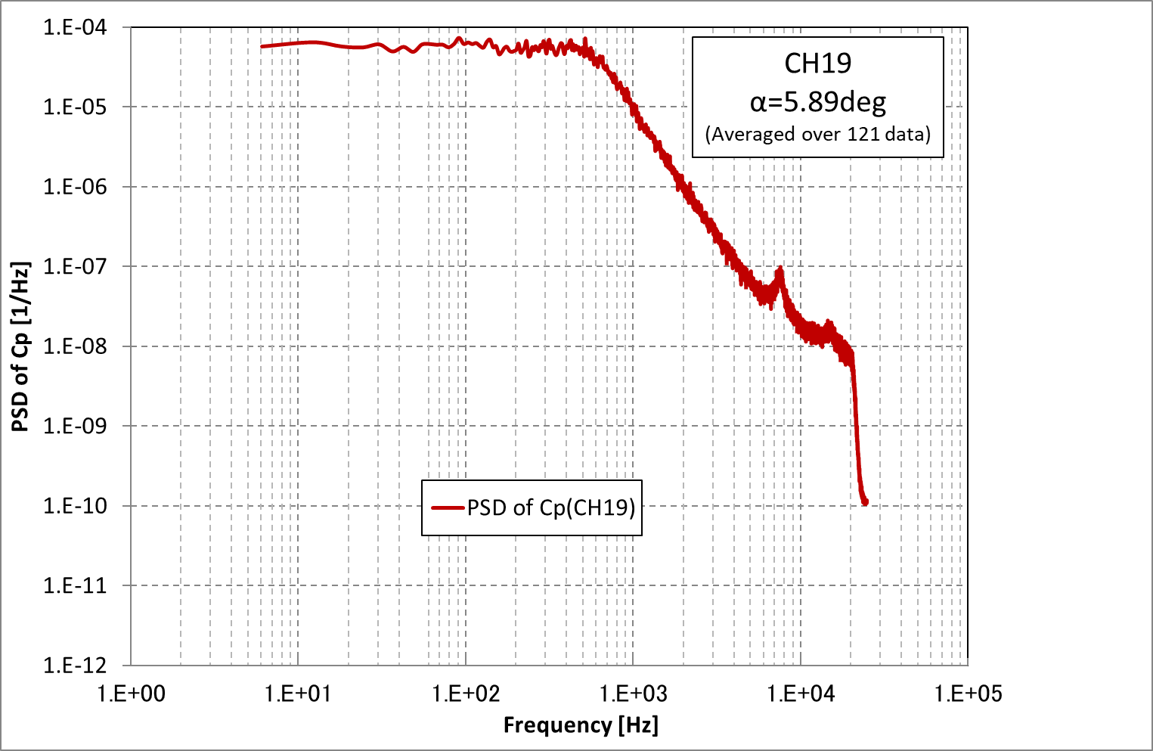
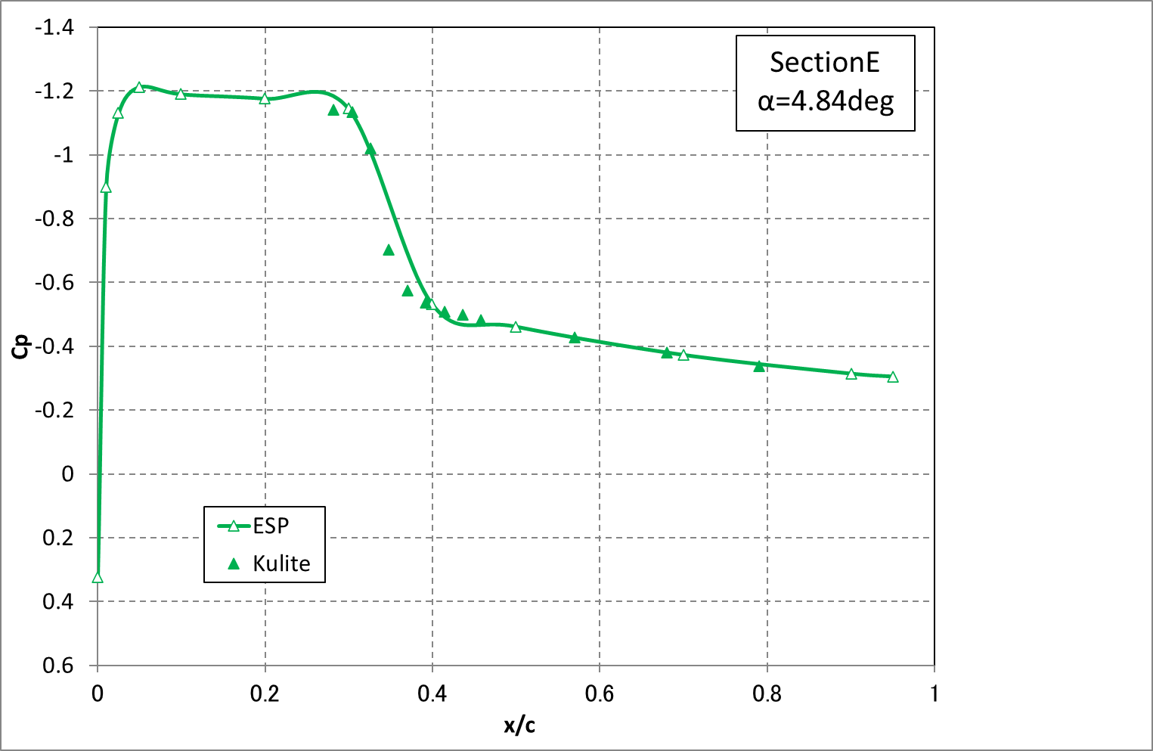
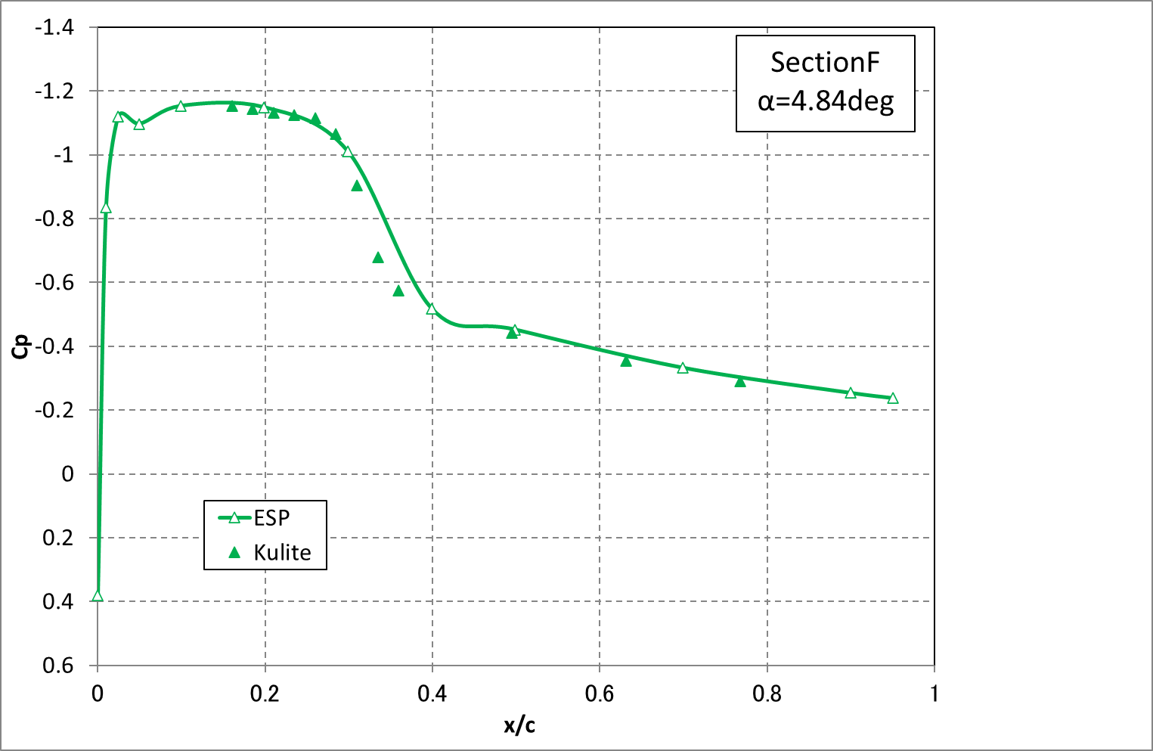
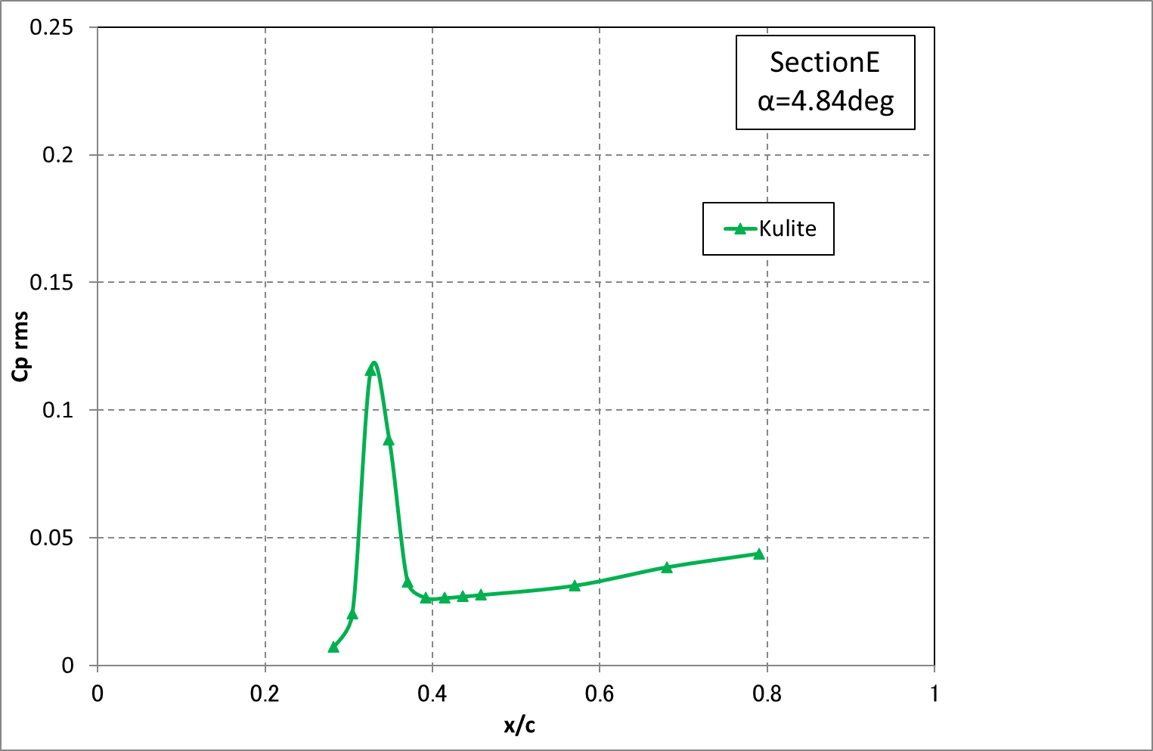
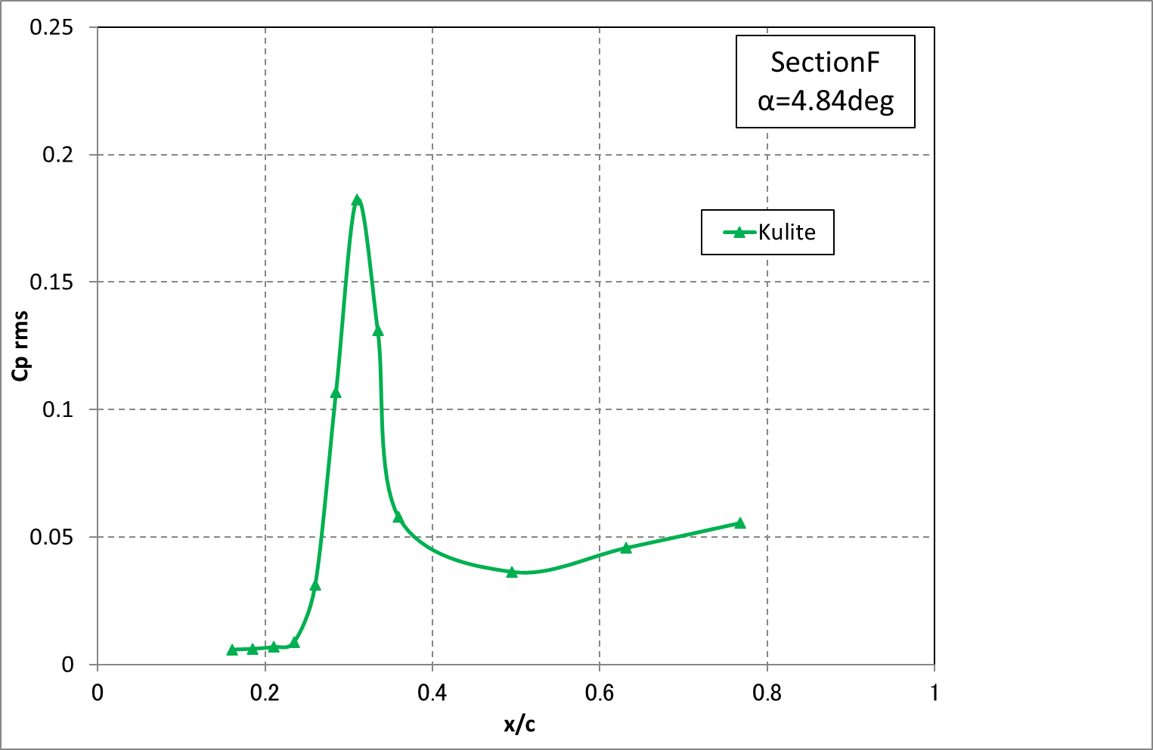
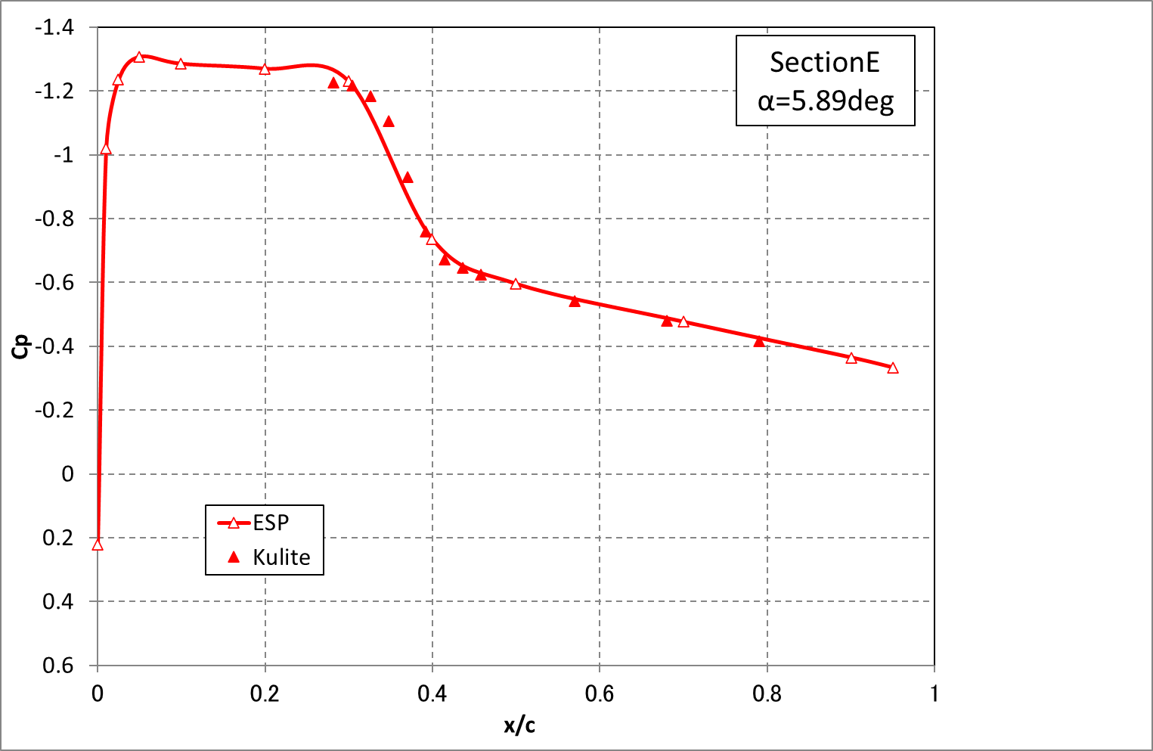
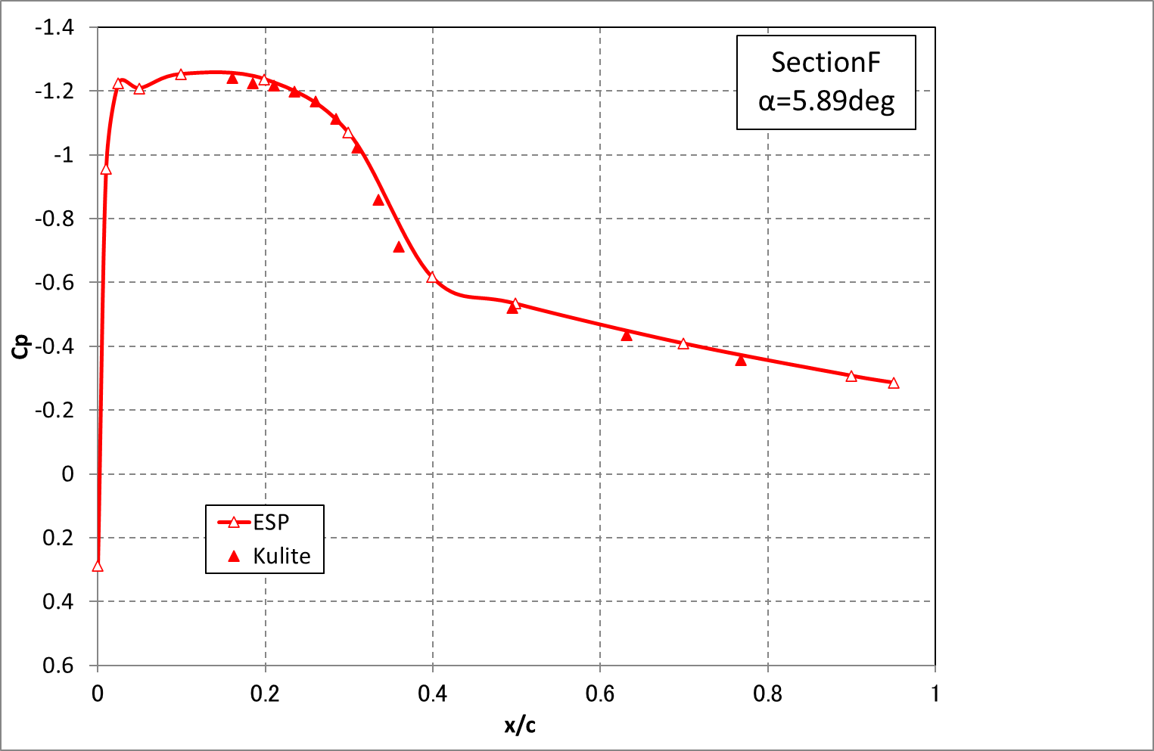
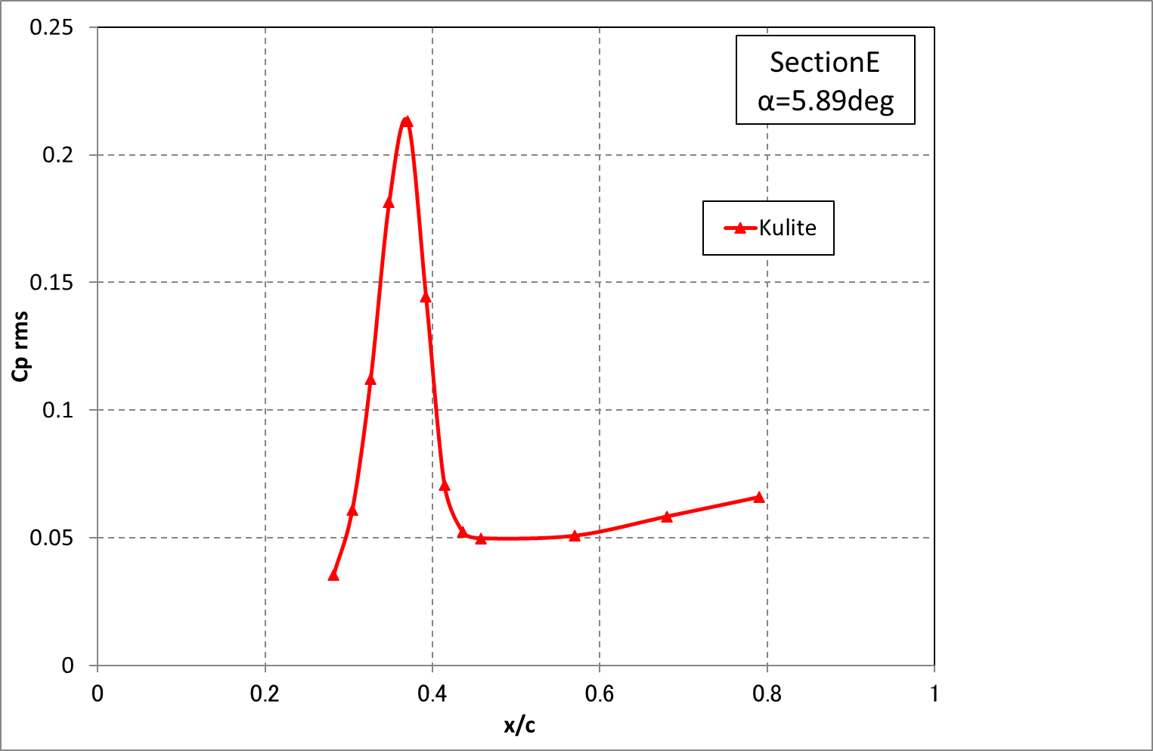
Cp distributions (Average,RMS)
Cp data was measured by:
- Cp by steady pressure sensor (ESP)
- Cp of average and RMS by unsteady pressure sensor (Kulite)
NOTE: The full-span model has a right "steady" wing and a left "unsteady" wing. Due to different equipment, right and left wings are structurally different, and therefore do not deform in the same way. Deformation measurements and CAD refer to the left "unsteady" wing, for which Kulite data are provided. Steady pressure sensor measurements from the right "steady" wing are also provided for reference. Differences in deformations result in slight differences between the steady (ESP) and time-averaged unsteady (Kulite) pressure measurements.
 |
 |
 |
 |
 |
 |
 |
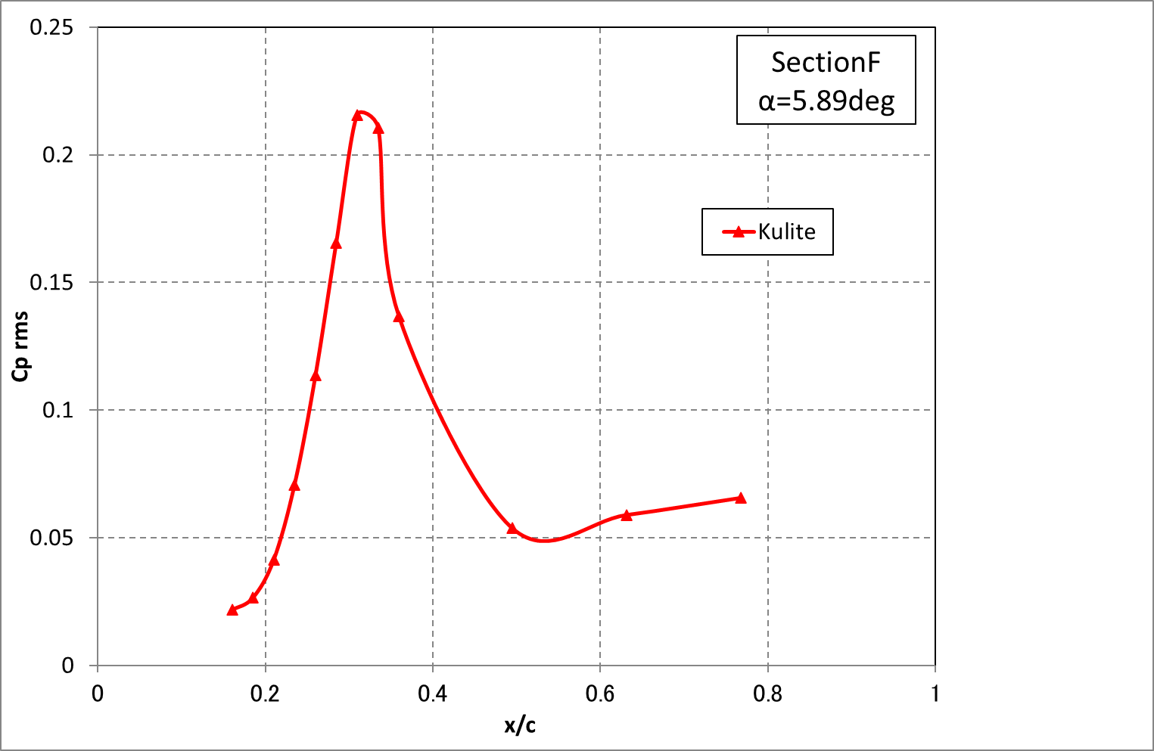 |
| Span location | y[mm] | η | Cp data (CSV format) |
| Section E | 317.318 | 0.500 | buffet-TC2_wingcp_dpw8.csv |
| Section F | 380.781 | 0.600 |