DPW-8 Test Case 3: Experimental data
References
For more details on the data, see the original reference paper (https://doi.org/10.1007/s00348-020-03118-y):
Sugioka, Y., Nakakita, K., Koike, S., Nakajima, T., Nonomura, T., and Asai, K., "Characteristic unsteady pressure field on a civil aifcraft wing related to the onset of transonic buffet", Experiments in Fluids (2021) 62:20
Related papers:
Sugioka, Y., Koike, S., Nakakita, K., Numata, D., Nonomura, T., and Asai, K., "Experimental analysis of transonic buffet on a 3D swept wing using fast-response pressure-sensitive paint", Experiments in Fluids (2018) 59:108.
Ohmichi, Y., Sugioka, Y., and Nakakita, K., "Stable dynamic mode decomposition algorithm for noisy pressure-sensitive-paint measurement data", AIAA Journal (2022) 60(3) 1965-1970
Sugioka, Y., Numata, D., Asai, K., Koike, S., Nakakita, K., and Nakajima, T., "Polymer/ceramic pressure-sensitive paint with reduced roughness for unsteady measurement in transonic flow", AIAA Journal (2018) 56(6), 2145-2156.
Copyright (c) JAXA Yosuke SUGIOKA. All Rights Reserved.
Geometry
The data shown in this page are measured on the 2.16% NASA-CRM model using JAXA wind tunnel test.
Reference Area, S = 0.179014 m2
Reference Chord, c = 0.15131 m( = MAC)
Reference Span, b = 1.26927 m( = span)
Moment Reference (X,Y,Z) = (0.72741, 0.0, 0.097627) m
Information on trip dots
| Trip |
Aeronautical trip dot (CAD Cut) |
| Diameter [mm] |
1.27 |
| Distance (between dot centers) [mm] |
2.54 |
| Height (main wing) [mm] |
0.09906 (inner-wing)
0.08890 (mid-wing)
0.07874 (outer-wing) |
| Location (main wing) |
10% chord (upper and lower sides) |
| Height (horizontal stabilizers) [mm] |
0.07874 |
| Location (horizontal stabilizers) |
10% chord (upper and lower sides) |
| Height (body) [mm] |
0.07874 |
| Location (body) |
1.5% body length (azimuthally around the nose) |
Inner wing: wing-body junction to Yehudi break (trailing-edge discontinuous bend); Mid/Outer wing: equally divided from Yehudi break to wing-tip.
NOTE: Given the differences in Reynolds number, the trip dot heights in Test Case 3 are different from those in Test Case 2.
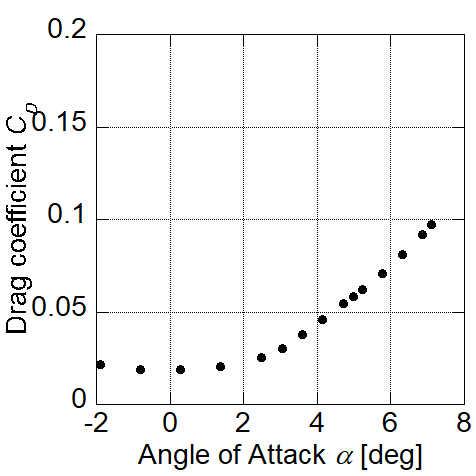
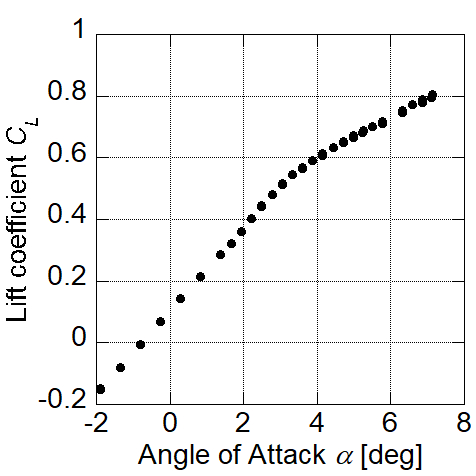
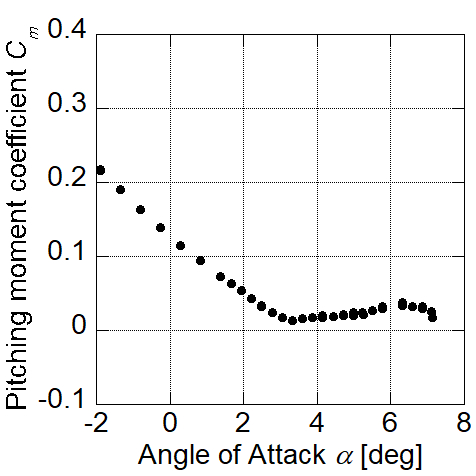
Aerodynamic coefficients
| RunNo. |
CaseNo. |
Re |
P0 |
T0 |
M |
α |
CD |
CL |
CmS |
CSV file |
| 5094 |
56 |
2.24 |
120.0 |
326.45 |
0.848 |
3.06 |
N/A |
0.51767 |
0.017 |
buffet-TC3_cdclcm_dpw8.csv
|
| 5094 |
58 |
2.23 |
120.0 |
326.45 |
0.849 |
3.61 |
N/A |
0.56757 |
0.016 |
| 5094 |
62 |
2.22 |
120.0 |
328.25 |
0.848 |
4.71 |
N/A |
0.65408 |
0.020 |
| Re |
: Reynolds number [million] based on MAC |
| P0 |
: Total pressure [kPa] |
| T0 |
: Total temperature [K] |
| M |
: Corrected Mach number [-] |
| α |
: Corrected angle of attack [deg] |
| CD |
: Corrected drag coefficient [-] |
| CL |
: Corrected lift coefficient [-] |
| CmS |
: Corrected pitching moment coefficient [-] |
NOTE 1: The values are corrected for JAXA wind tunnel test. Additional corrections have been done with respect to the original reference paper and some differences exist on the corrected angles of attack.
NOTE 2: The aerodynamic coefficients were measured either simultaneously with PSP measurements (indicated as “PSP” in the data file) or independently as standalone balance measurements (indicated as “BL” in the data file). Since the force measurements were conducted before the pre-heating of the wind tunnel and balance had been completed, the drag coefficients measured simultaneously with the PSP tests are not provided.
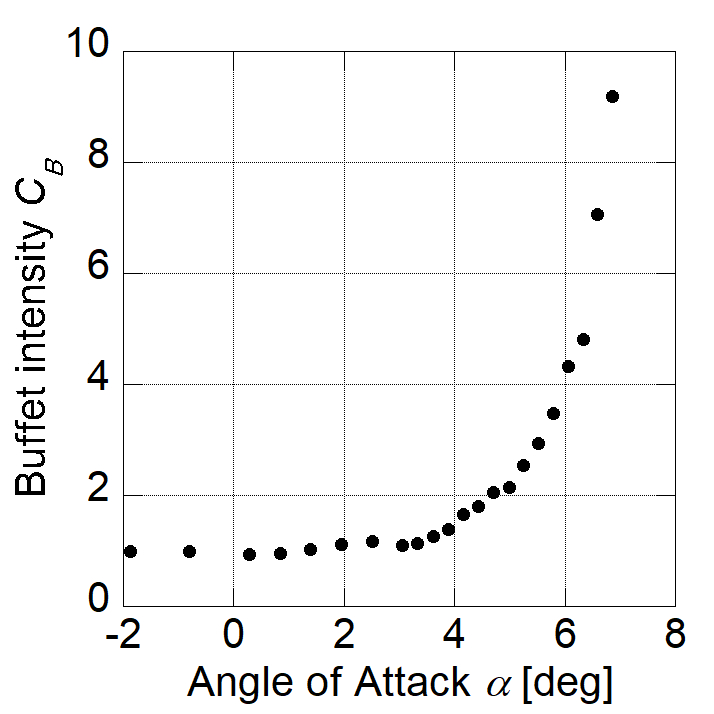
Buffet Intensity Coefficient
Buffet intensity coefficient: buffet-TC3_buffet-intensity_dpw8.csv |
CB is the buffet intensity coefficient and was measured using the wing-root strain gate signal SSTG as:
CB = (SSTG(α))rms / (SSTG0)rms
where: (SSTG0)rms is the wing-root straing gauge signal under the zero-lift conditoin at α=-0.8deg.
The buffet intensity coefficient can be used an indicator for buffet onset.
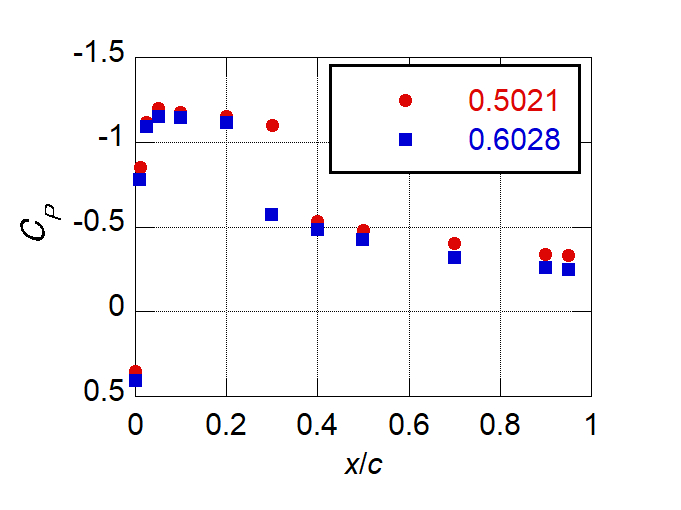
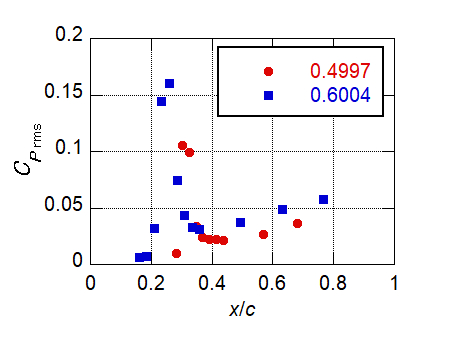
Cp sectional distributions (Average, RMS, PSD) from steady pressure and Kulite sensors
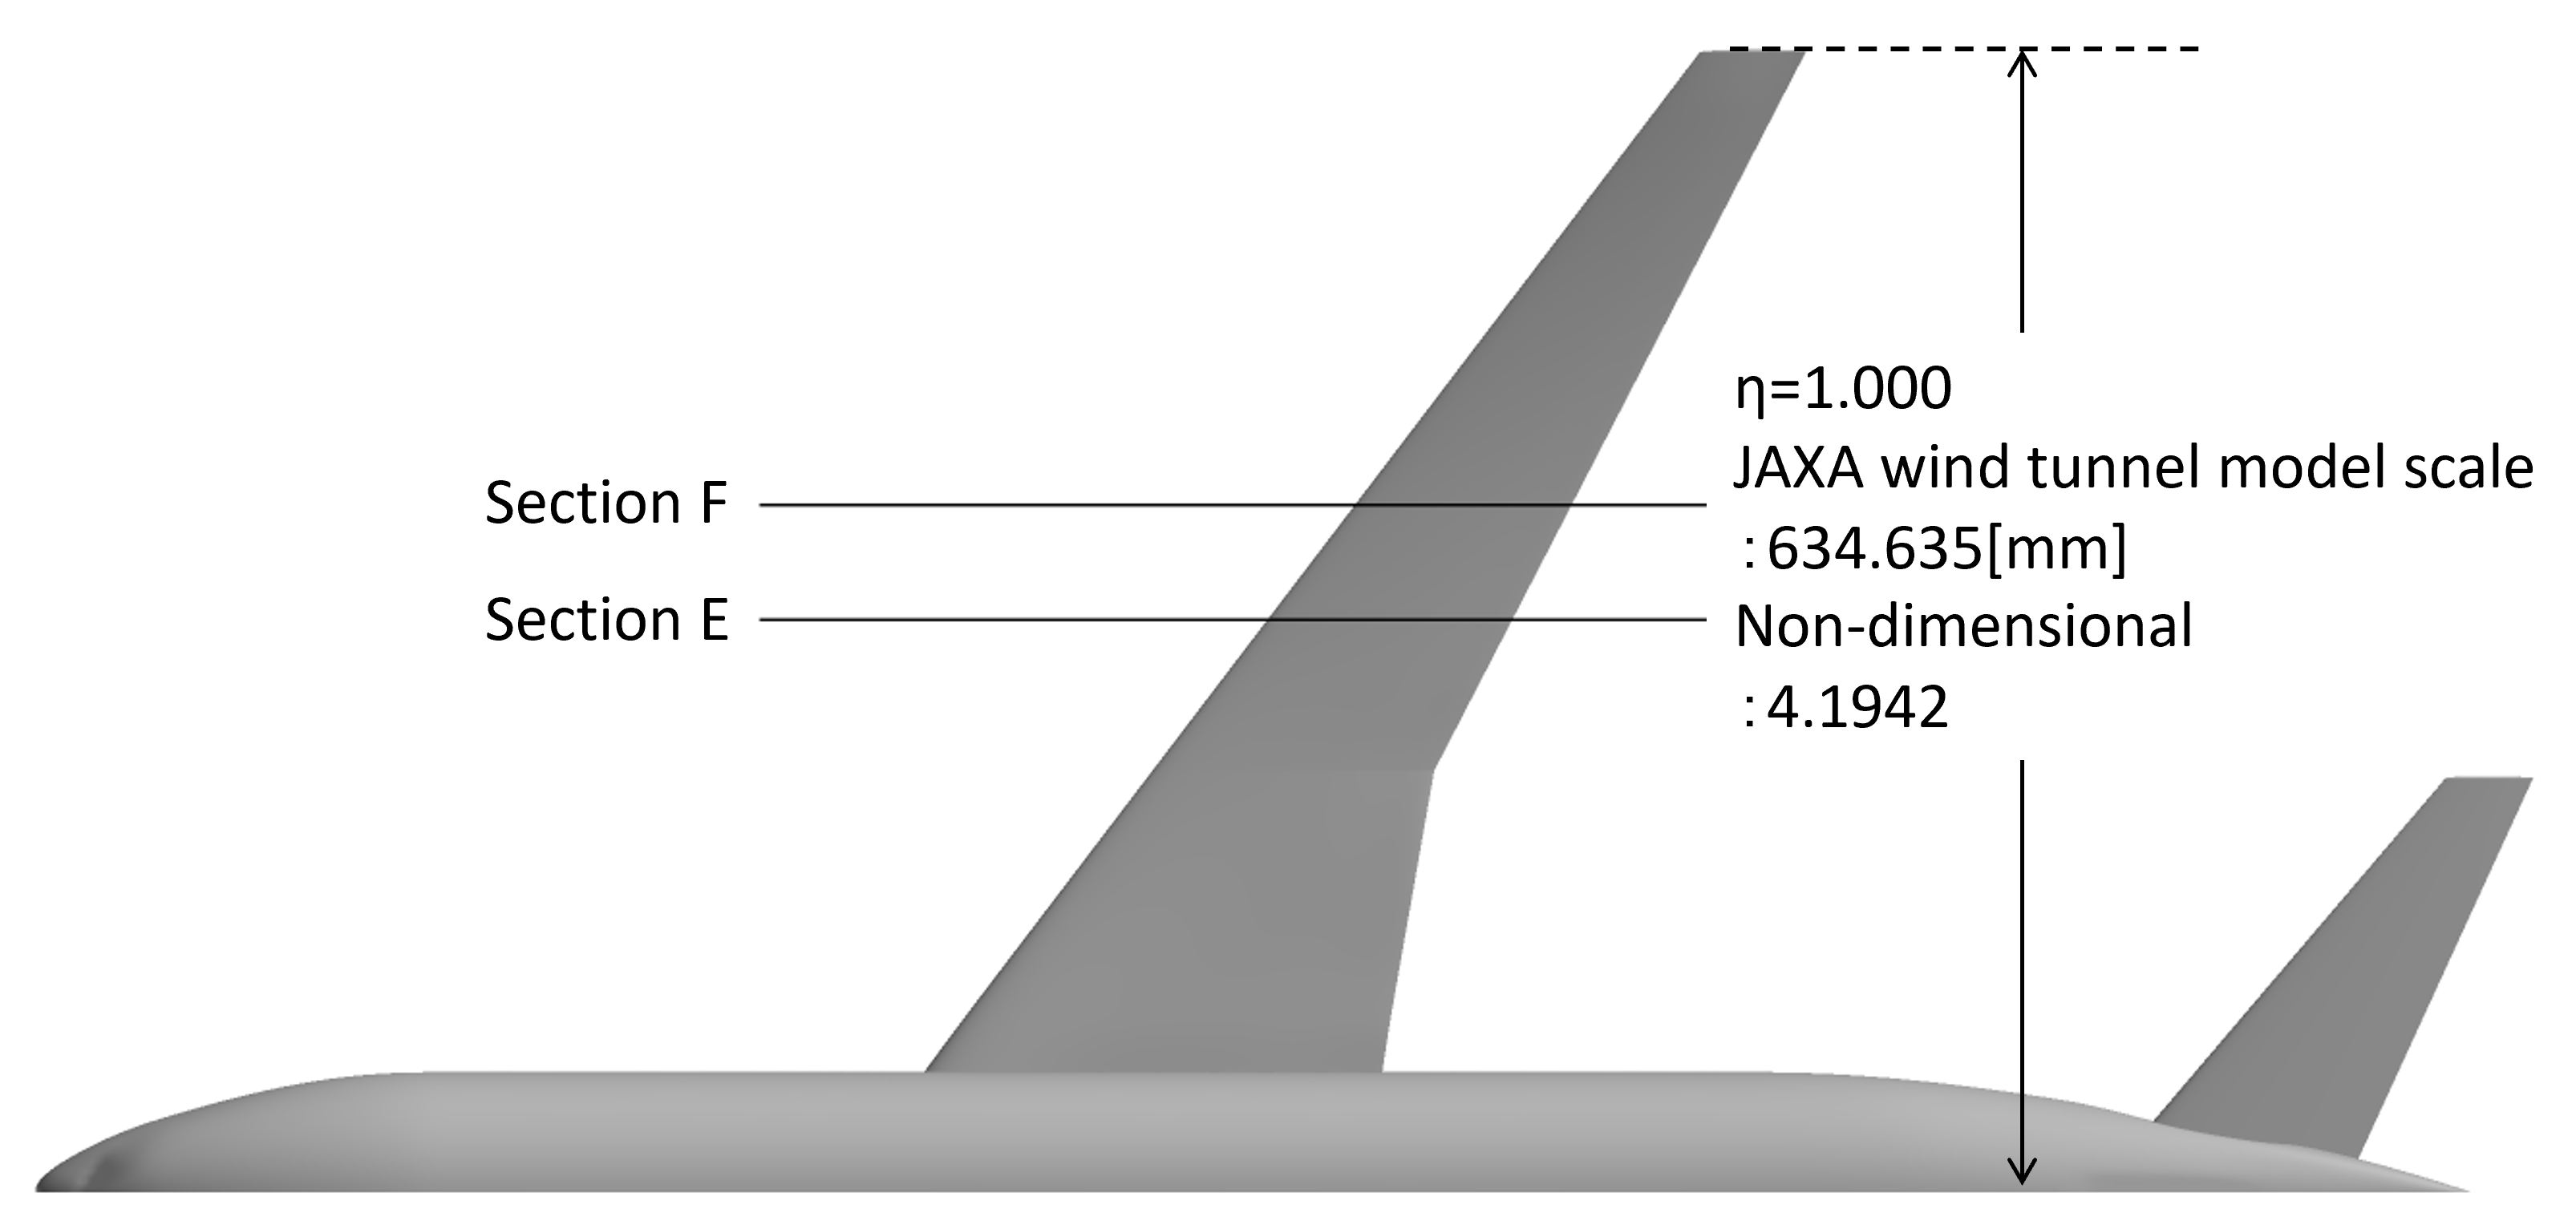
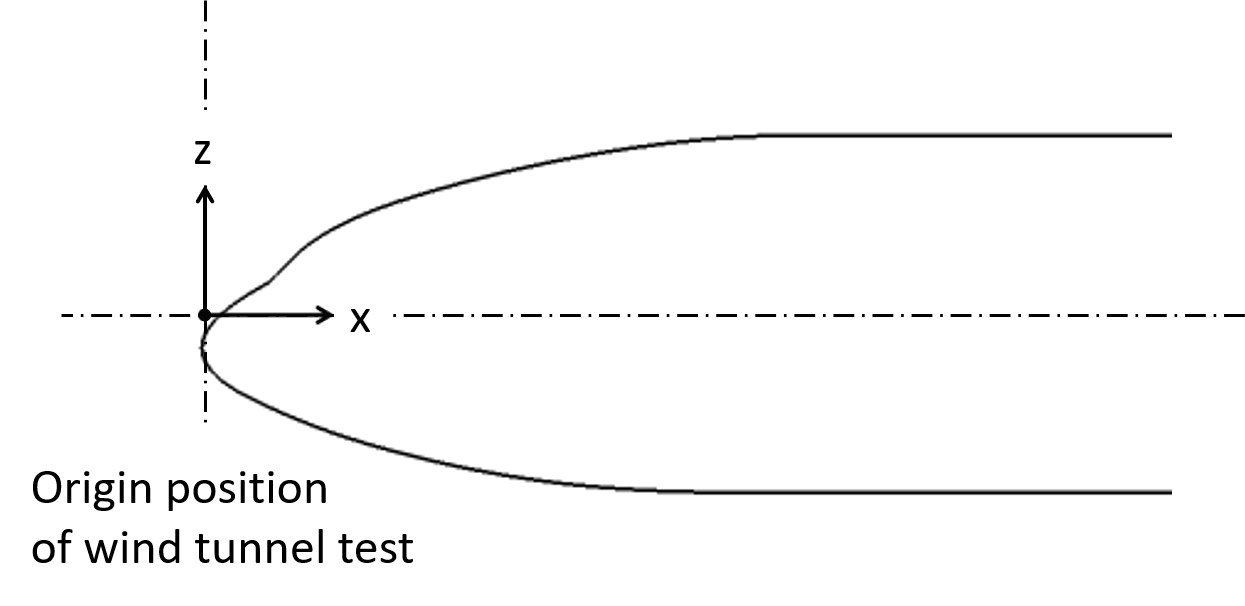
Cp data was measured on two spanwise sections (indicated in the figure above) by:
- Cp (time averaged) by steady pressure sensor (ESP)
- Cp-rms by unsteady pressure sensor (Kulite)
Example figures for α=4.71deg are given below:
 |
 |
 |
NOTE 1: The full-span model has a left "steady" wing and a right "unsteady" wing. Both time-averaged Cp data by ESP and rms pressure fluctuations data by Kulite sensors are measured on the right "unsteady" wing.
NOTE 2: Please note the PSD peak around 9 kHz is due to wind tunnel noise.
NOTE 3: For the exact location of each Kulite sensor and corresponding numbering, please check the AoA*_Cp_ESP.csv files.
Cp distributions (Average, RMS, PSD) from unsteady Pressure Sensitive Paint (uPSP)
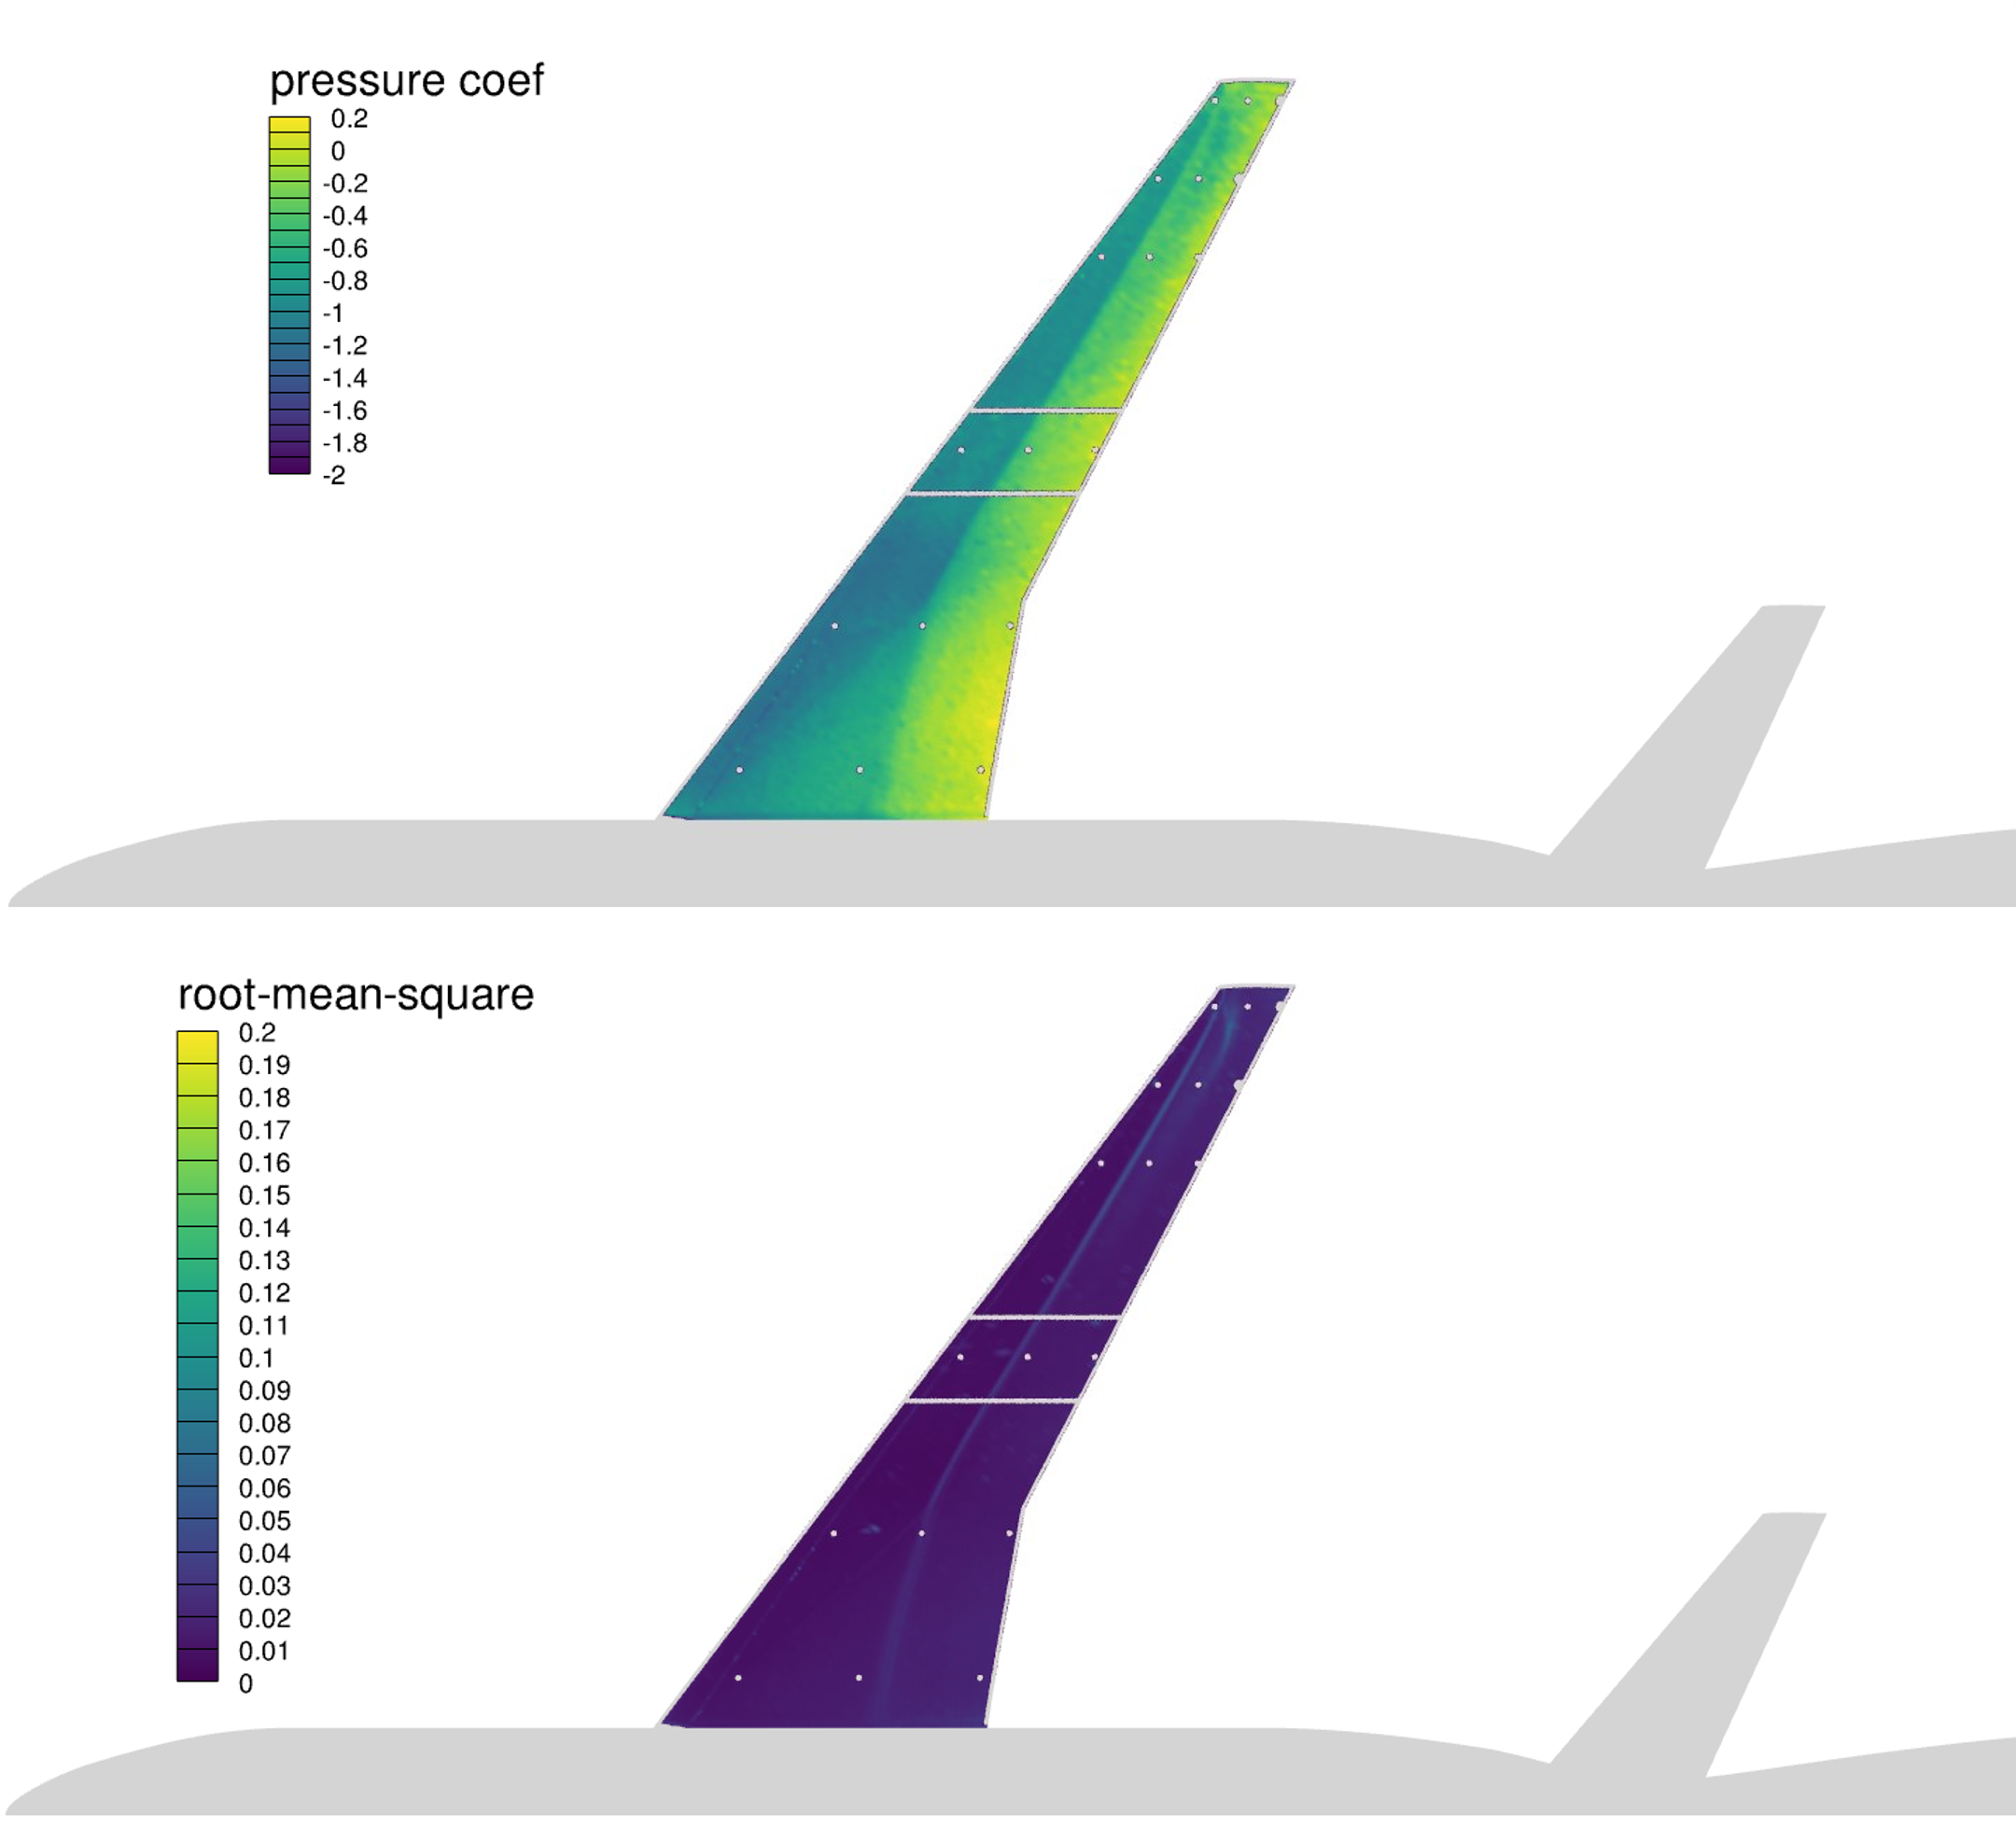
The uPSP data have been mapped on the CRM jig shape (rescaled with mean aerodynamic chord).
The .dat files can be read in Tecplot and contain (x, y, z) coordinates, uPSP time-averaged pressure coefficient, and uPSP RMS pressure.
Masks have been applied to regions where the measurements are not reliable (unsteady pressure sensor lines, markers, areas near the model edges).
Sectional Cp distributions close to the spanwise locations of the Kulite sensor lines have also been provided. However, the root-mean squre pressure coefficients measured by the uPSP show some differences due to the camera exposure time that introduces low-pass filtering effects.
 |
 |
| α (deg) |
data (ZIP format) |
ZIP file content: |
| 3.06 |
upsp_AoA306.zip |
AoA*_Cp_upsp_eta05.csv (time-averaged and rms Cp at η=0.5 from uPSP)
AoA*_Cp_upsp_eta06.csv (time-averaged and rms Cp at η=0.6 from uPSP)
AoA*_Cp-Cprms_upsp_surface.dat (time-averaged and rms Cp uPSP on the wing surface)
AoA*_PSD_upsp_surface.dat (uPSP-based PSD on the wing surface)
AoA*_time-snapshots_upsp_surface.dat (uPSP snapshots on the wing surface)
|
| 3.61 |
upsp_AoA361.zip |
| 4.71 |
upsp_AoA471.zip |
Deformation data
While official deformation measurements for this campaign are still pending, we can provide a preliminary data point for CFD qualitative validation: the wing tip exhibits a vertical deflection of approximately 10-12 mm at an Angle of Attack of 4.7 deg.
Home